Overview
Counting and outlining cell nuclei in H&E-stained tissue is a basic step in computational pathology: nuclear density, size and shape variation all carry diagnostic signal. Segment Anything (SAM) models segment well in general but aren't trained on histology. They also usually need a human to click or draw boxes. This project adapts MobileSAM, a lightweight SAM variant with a TinyViT image encoder, to nuclei without prompts and while training almost nothing.
Approach
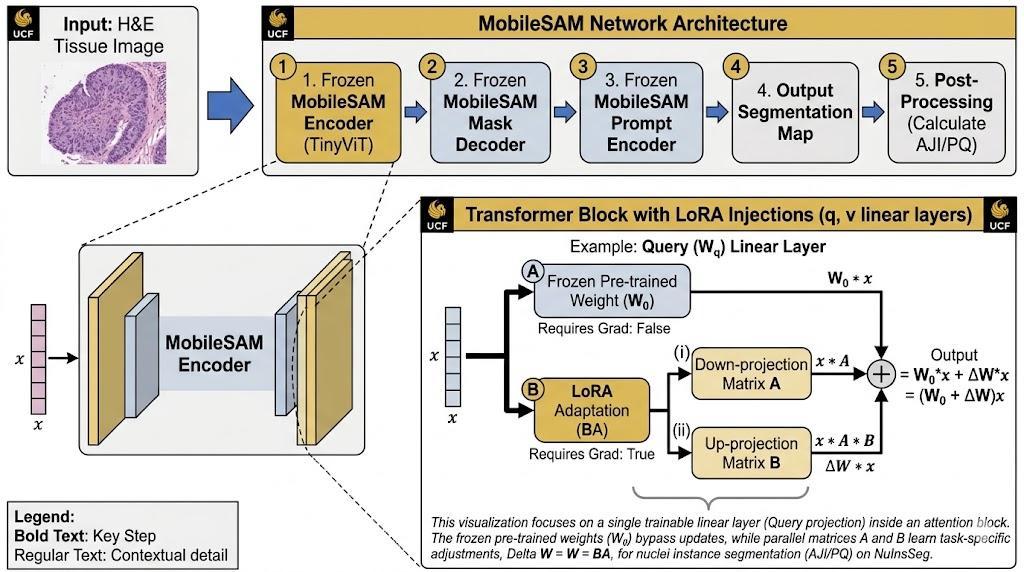
- LoRA on the image encoder. Every attention
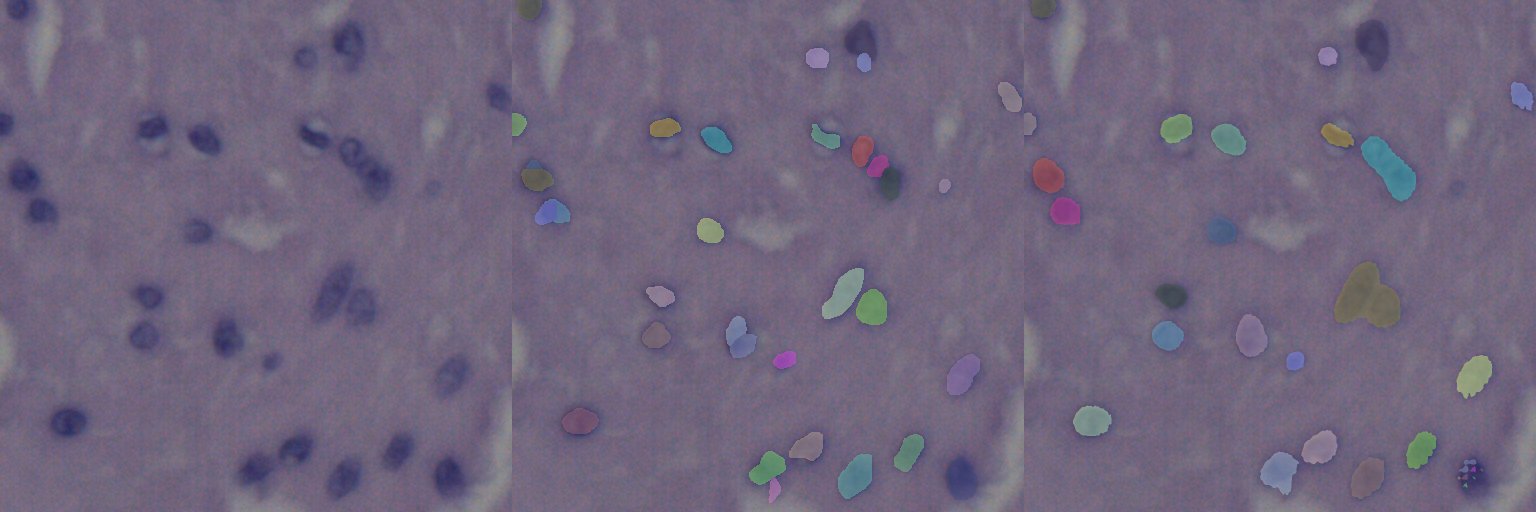
qkvprojection in TinyViT is wrapped with a rank-4 low-rank adapter (α = 8), and all original weights stay frozen. Only 29,696 parameters are trained, about 0.3% of MobileSAM. - Prompt-free decoding. The mask decoder gets an empty prompt and predicts a nuclei probability map for the whole tile in a single pass. Thresholding plus connected components turns it into nucleus instances; in the deployed version the logits are lightly smoothed first and a distance-transform watershed then splits touching nuclei.
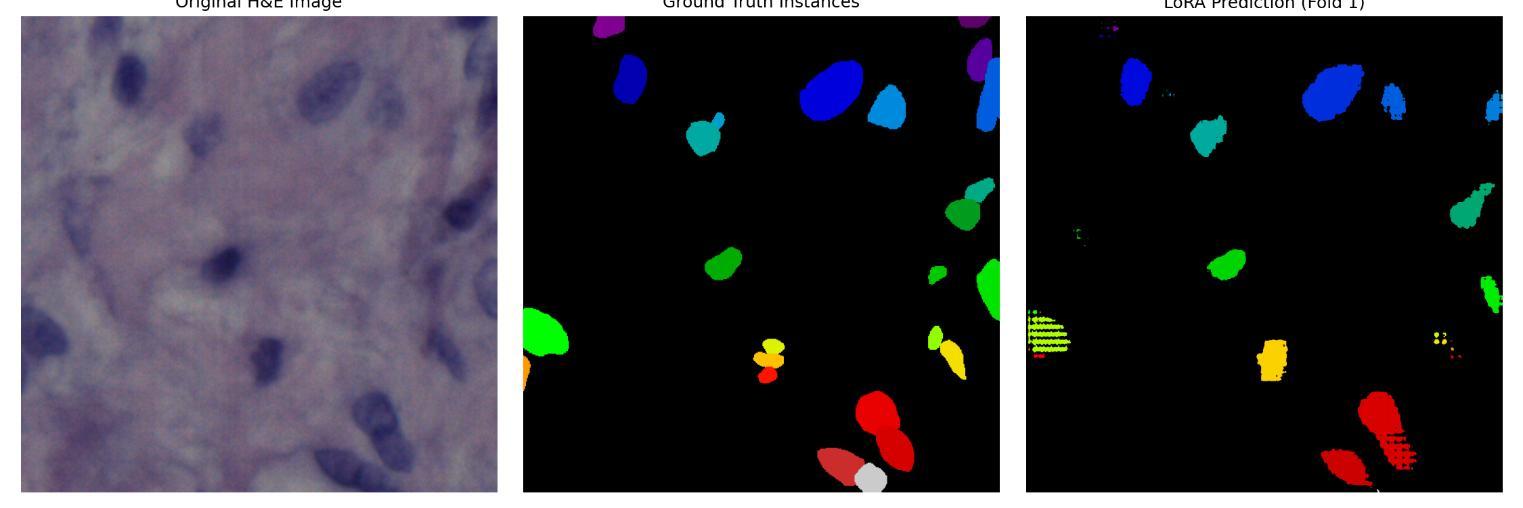
- Training. NuInsSeg (665 H&E tiles from 31 human and mouse organs) at 1024×1024, BCE loss, AdamW (learning rate 1e-4), batch 2, 5-fold cross-validation (10 epochs per fold in the course report).
- Evaluation. Dice for pixel accuracy, plus the instance-level metrics used in pathology: Aggregated Jaccard Index (AJI) and Panoptic Quality (PQ), which reward separating each nucleus correctly.
Results
The course report trained 10 epochs per fold (5-fold mean Dice 0.61) with the loss still falling. I retrained on fold 1 for 30 epochs with everything else unchanged and measured the same 133 held-out tiles through the deployed ONNX pipeline, using the standard AJI (Kumar et al., 2017) and PQ (Kirillov et al., 2019) definitions:
| Fold 1 (133 held-out tiles) | Dice | AJI | PQ |
|---|---|---|---|
| 10 epochs (course setup) | 0.673 | 0.300 | 0.246 |
| 30 epochs | 0.720 | 0.283 | 0.267 |
| 30 epochs + smoothing and watershed split (deployed) | 0.720 | 0.404 | 0.336 |
Longer training improves pixel accuracy. Splitting touching nuclei (after lightly smoothing the logits) is what improves the instance metrics, and it fixes the count: the median ratio of predicted to true nuclei per tile went from 0.75 to 0.97, and its correlation with the true count from 0.38 to 0.70.
A note on the metrics. While re-evaluating, I found that the AJI formula in the original course script subtracts the matched intersection twice, which inflates AJI (it can even exceed 1). The report's AJI figures therefore aren't comparable to published results; the table above uses the standard definitions.
In production: Med-VQA nuclei analysis
I merged the 30-epoch LoRA weights back into the base model (W' = W + (A·B)·α/r), so it runs as a plain MobileSAM, and exported it to ONNX (52 MB, ~1–2 s per image on CPU, identical masks to PyTorch) for the Med-VQA server. With the nuclei analysis toggle on, an H&E histology image gets an approximate nuclei count, its cellularity (sparse, moderate or dense; the cut-offs are the ground-truth tertiles) and an overlay with every detected nucleus outlined. The answer model uses those measurements as evidence, and for non-histology images the answer says the tool doesn't apply.
Nuclear size variation is deliberately not reported. On held-out tiles the model's spread of nucleus sizes didn't correlate with the ground truth's, so it would have been a misleading sign of atypia. Cellularity does track the ground truth (r = 0.87).